Stockpile Quantity Takeoff Using Drone Survey in Gujarat
A stockpile of sand and aggregate does not sit still for long. Trucks load from it, rain compacts it, and by the time a client wants a number for billing or inventory, the pile has usually already changed shape. That is the exact problem a construction material supplier in Gujarat brought to Trishunya: how much material is actually sitting on the ground, right now, and how sure can we be about that number.
Stockpile volume disputes are common in the construction material business. A few percentage points of error on a large mass translate directly into money, and clients rarely trust a single method blindly. So instead of running one survey and calling it done, our team ran the site through two independent measurement techniques, drone based photogrammetry and DGPS rover point capture, specifically to cross check the result before it went into the client's report.
Why we ran two survey methods on the same pile
Sand and aggregate stockpile quantity takeoff is one of those tasks where a drone survey alone is usually enough, but "usually enough" is not a phrase that holds up in a commercial dispute. So on this project, we treated the DGPS rover data as a physical check against the drone derived model, rather than as a backup plan. If the two agreed closely, the client gets a number they can defend. If they disagreed, we would know something needed a second look before submission.
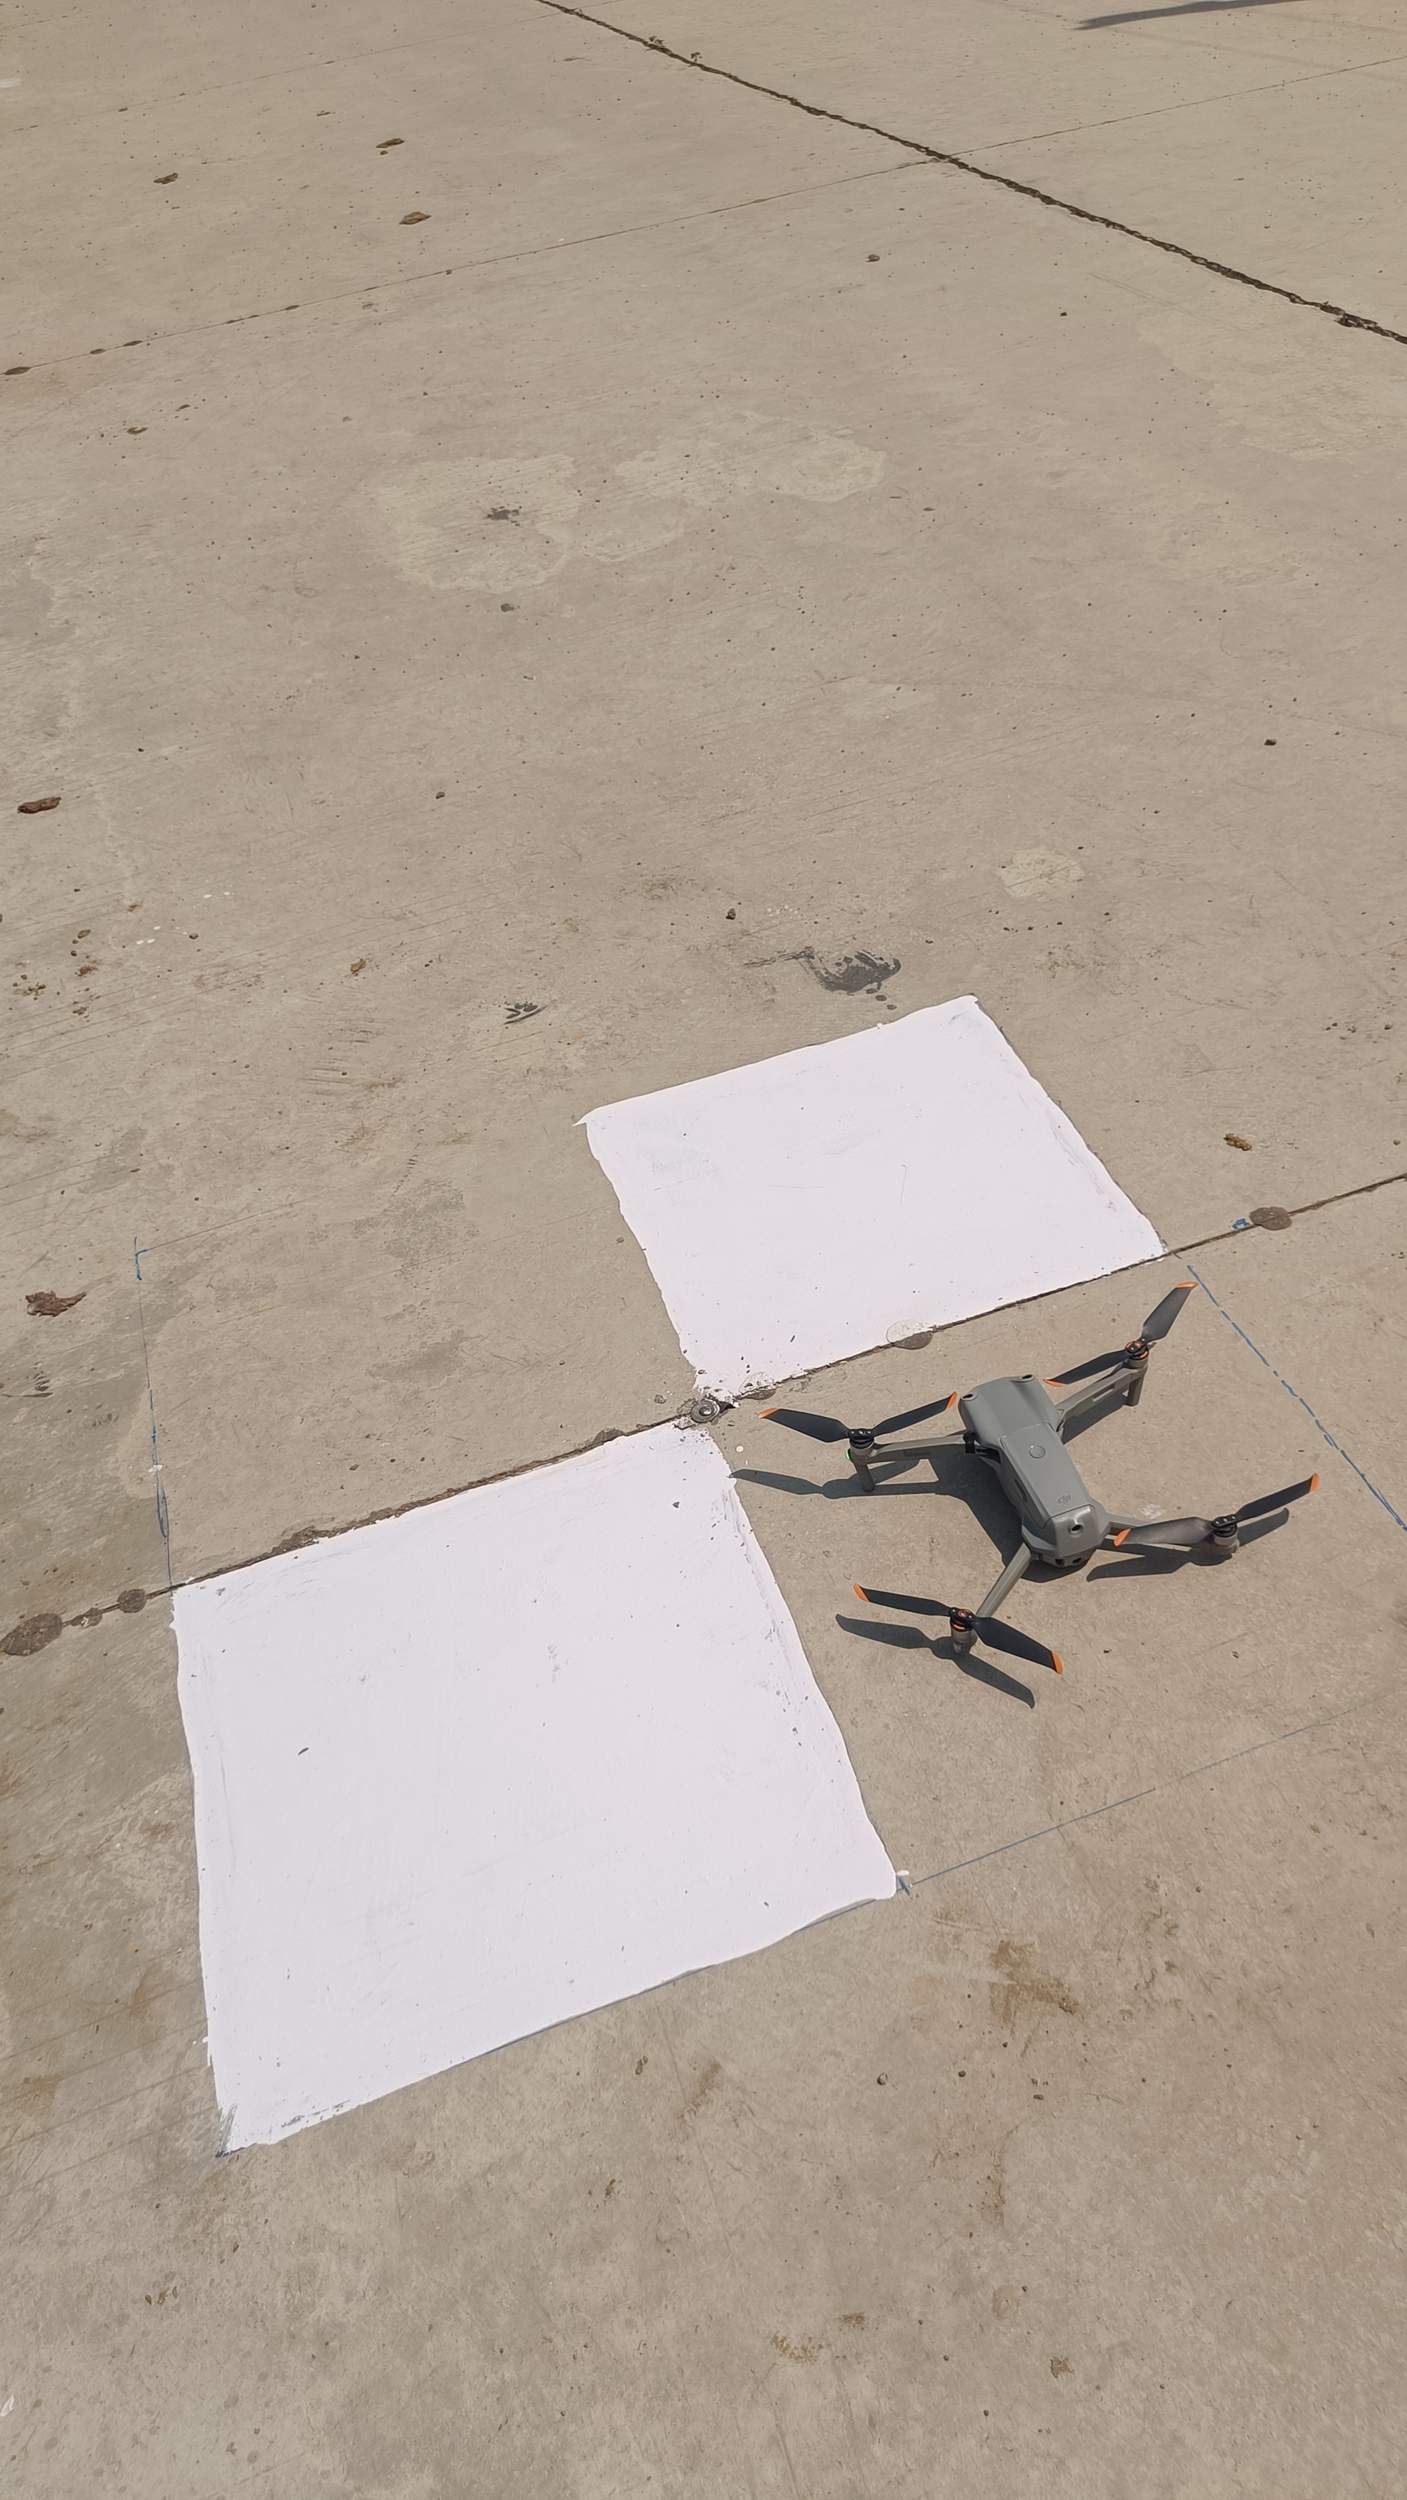
Step 1: GCP marking on pavement
Ground control points were painted on a nearby flat road pavement, chosen deliberately over the loose stockpile surface for stability and easy DGPS occupation.
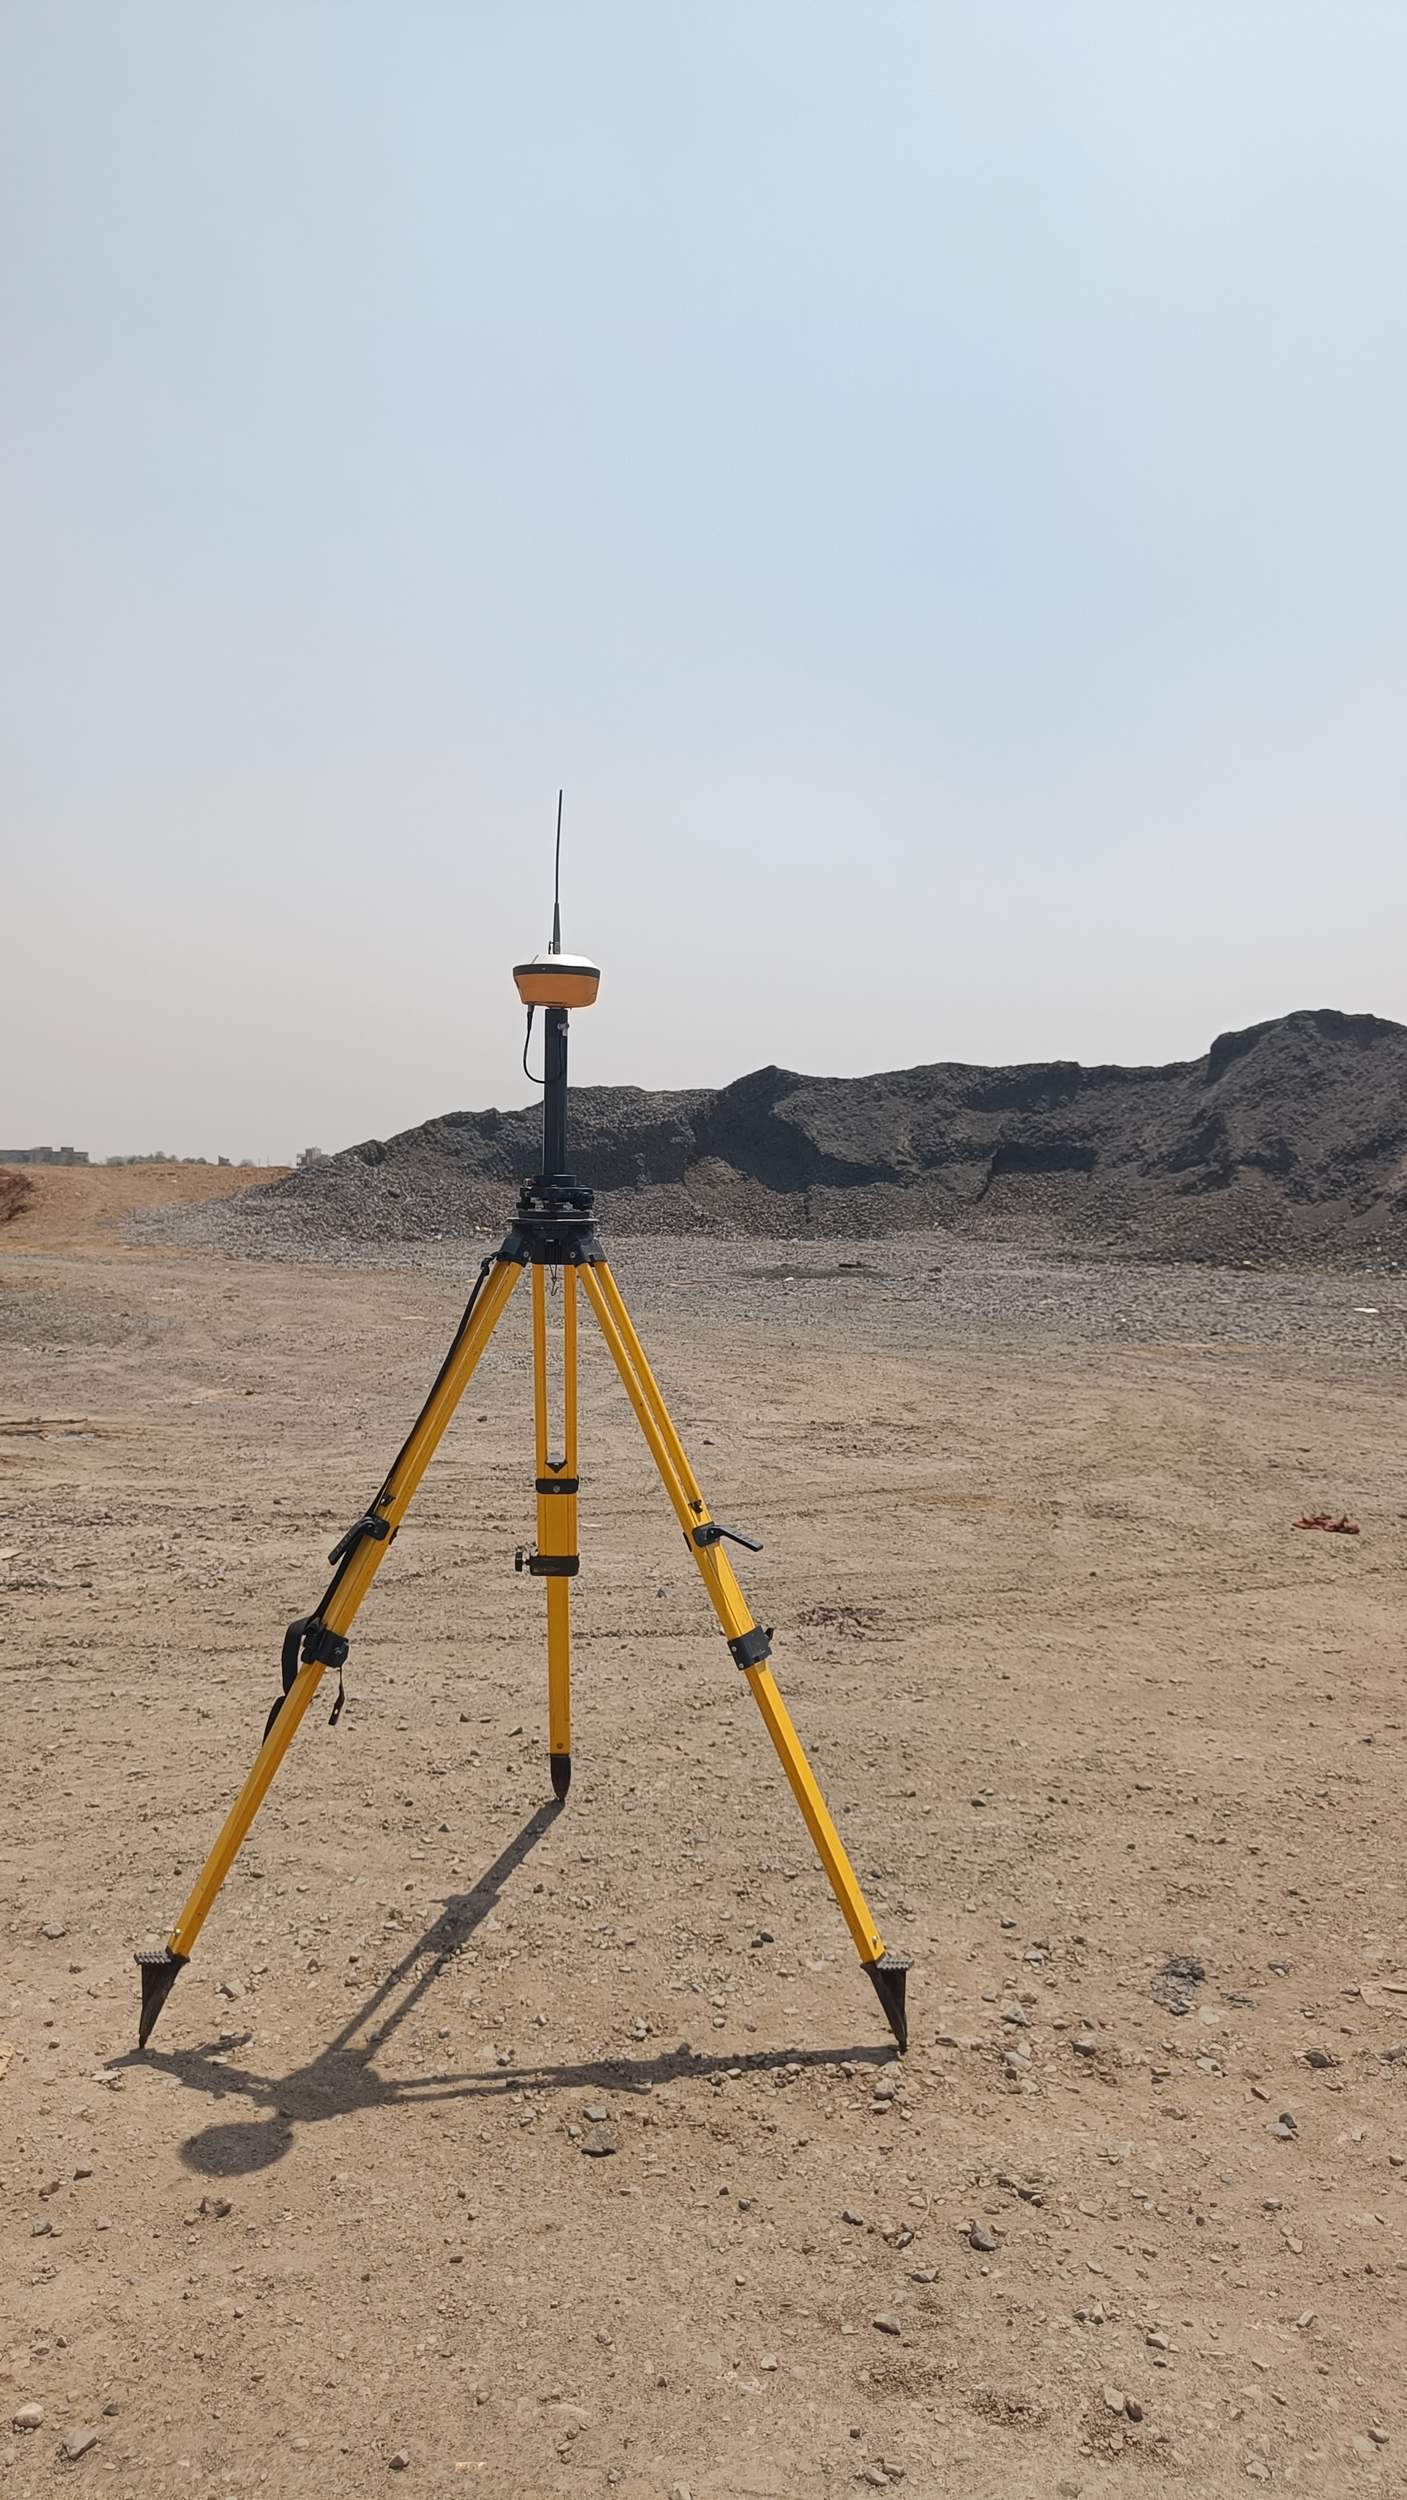
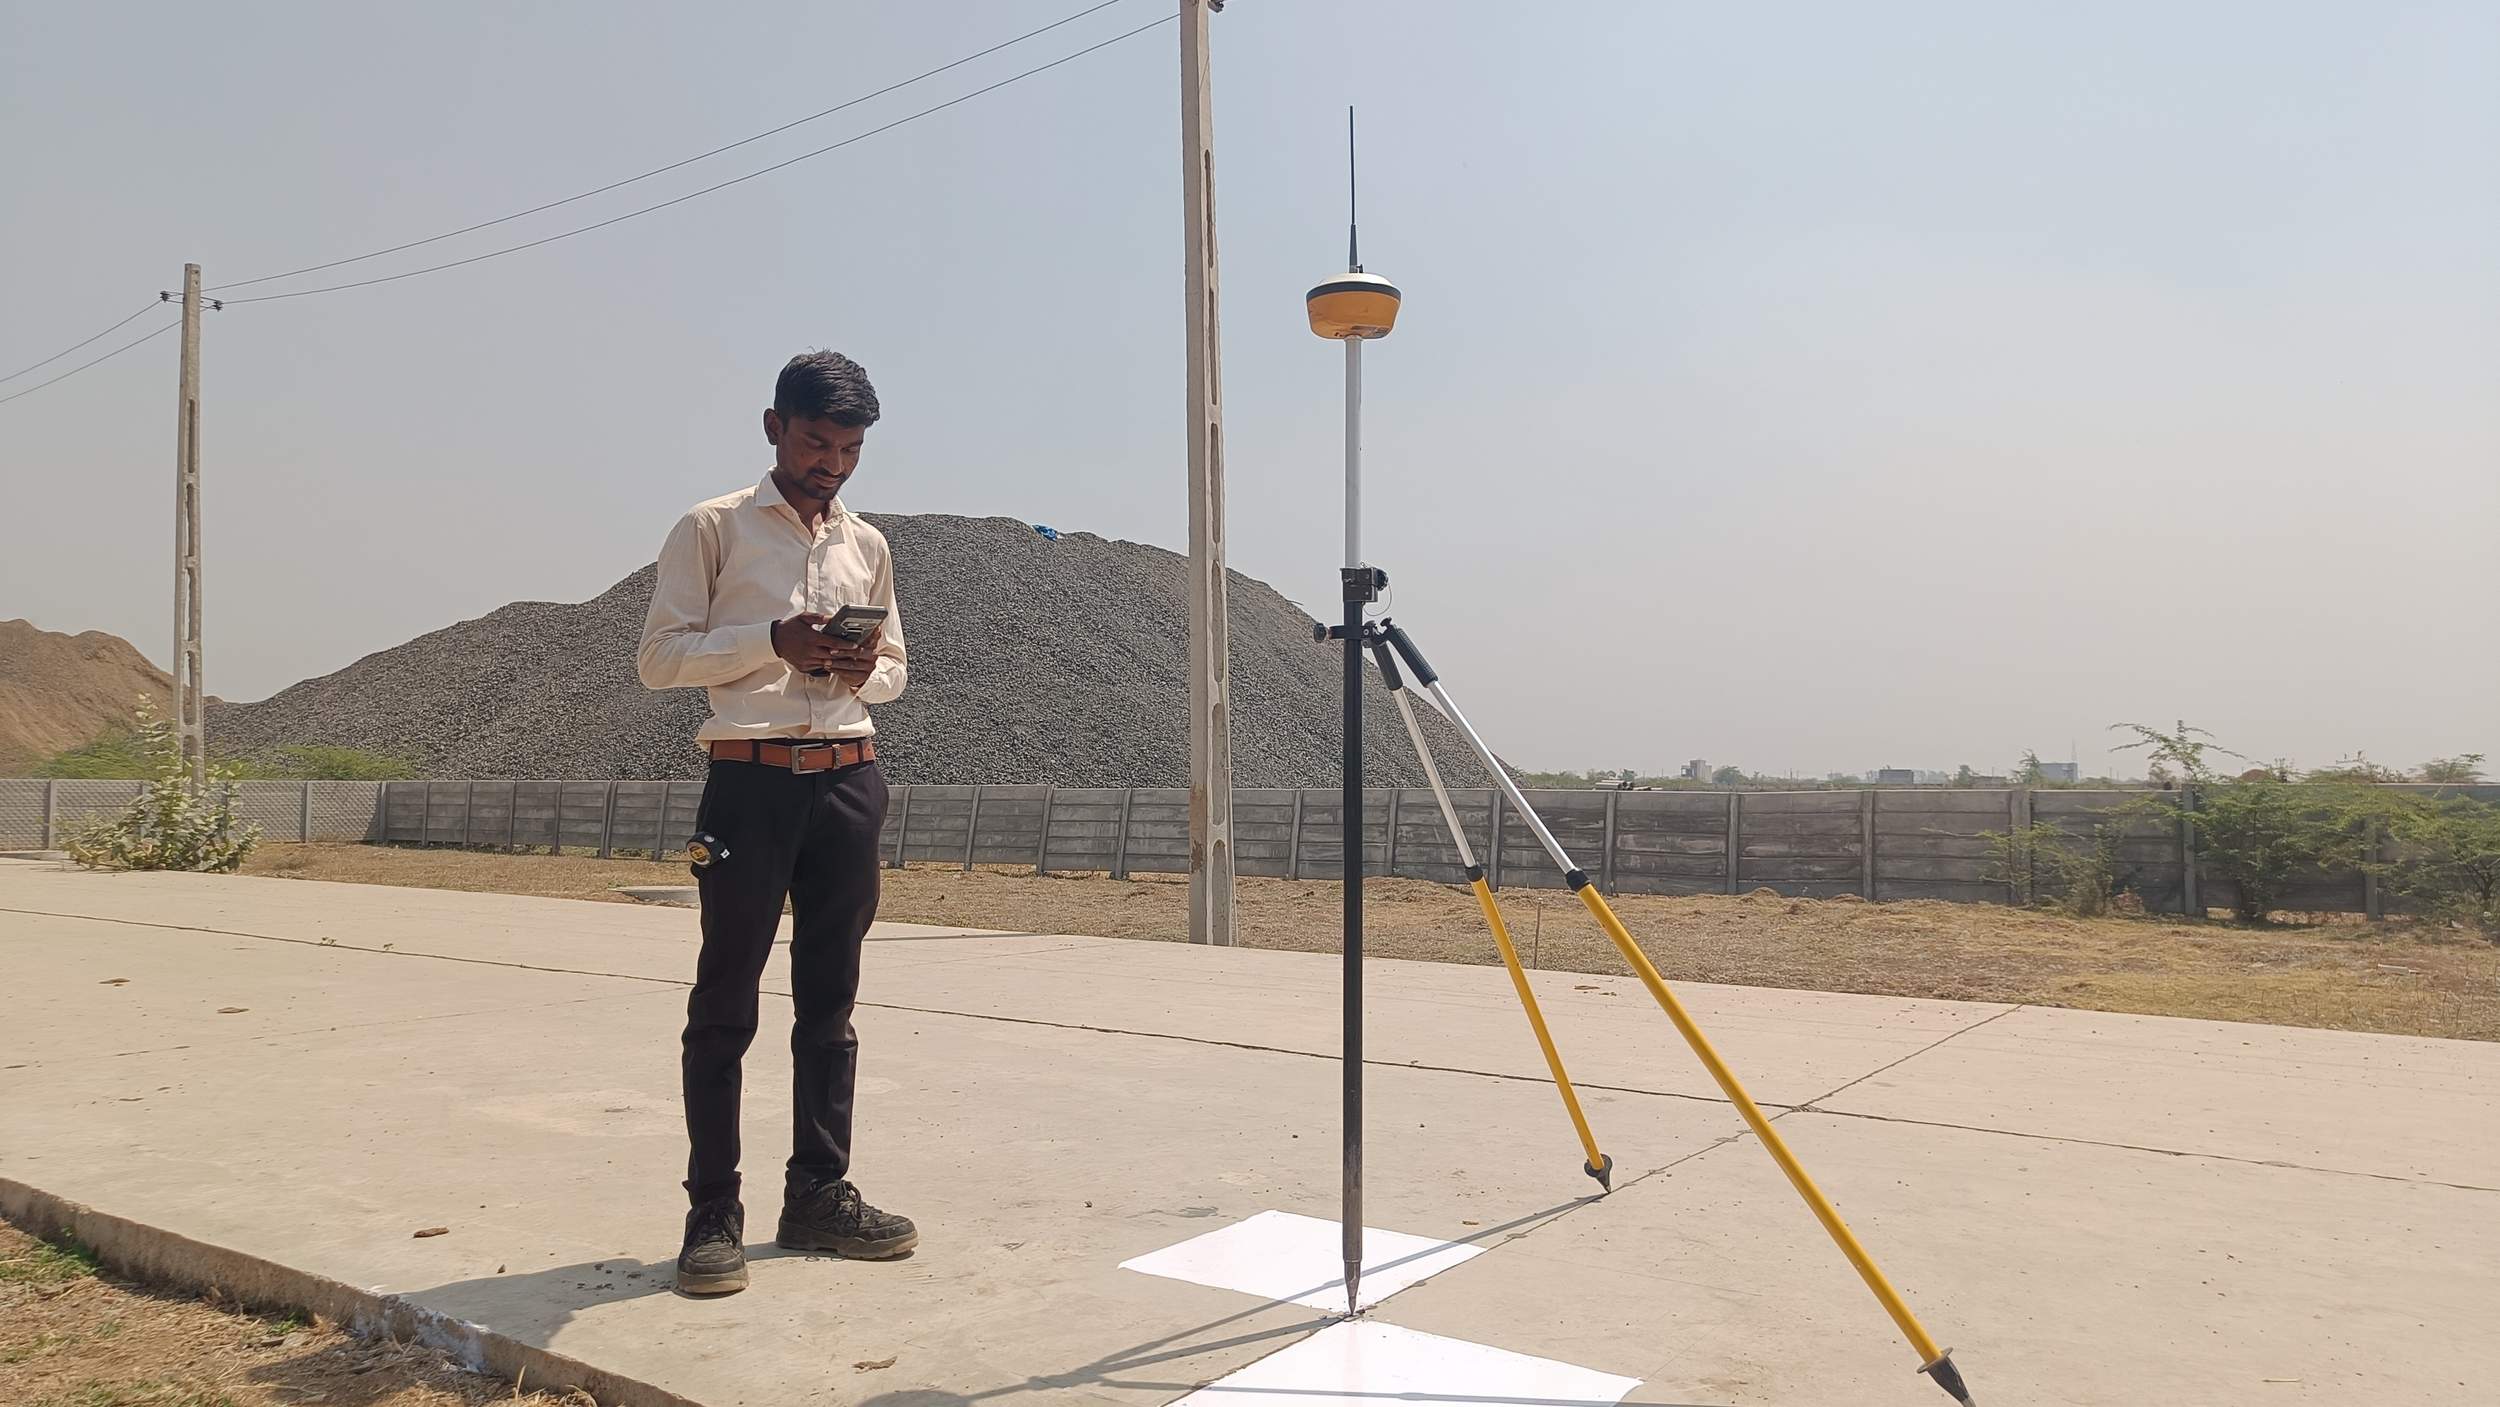
Step 2: High accuracy GCP capture
Each GCP was observed with the DGPS device mounted on a bipod for a longer duration, keeping the antenna steady while it logged satellite data, rather than relying on a hand held pole.
Step 3: Circular drone flight around the stockpile
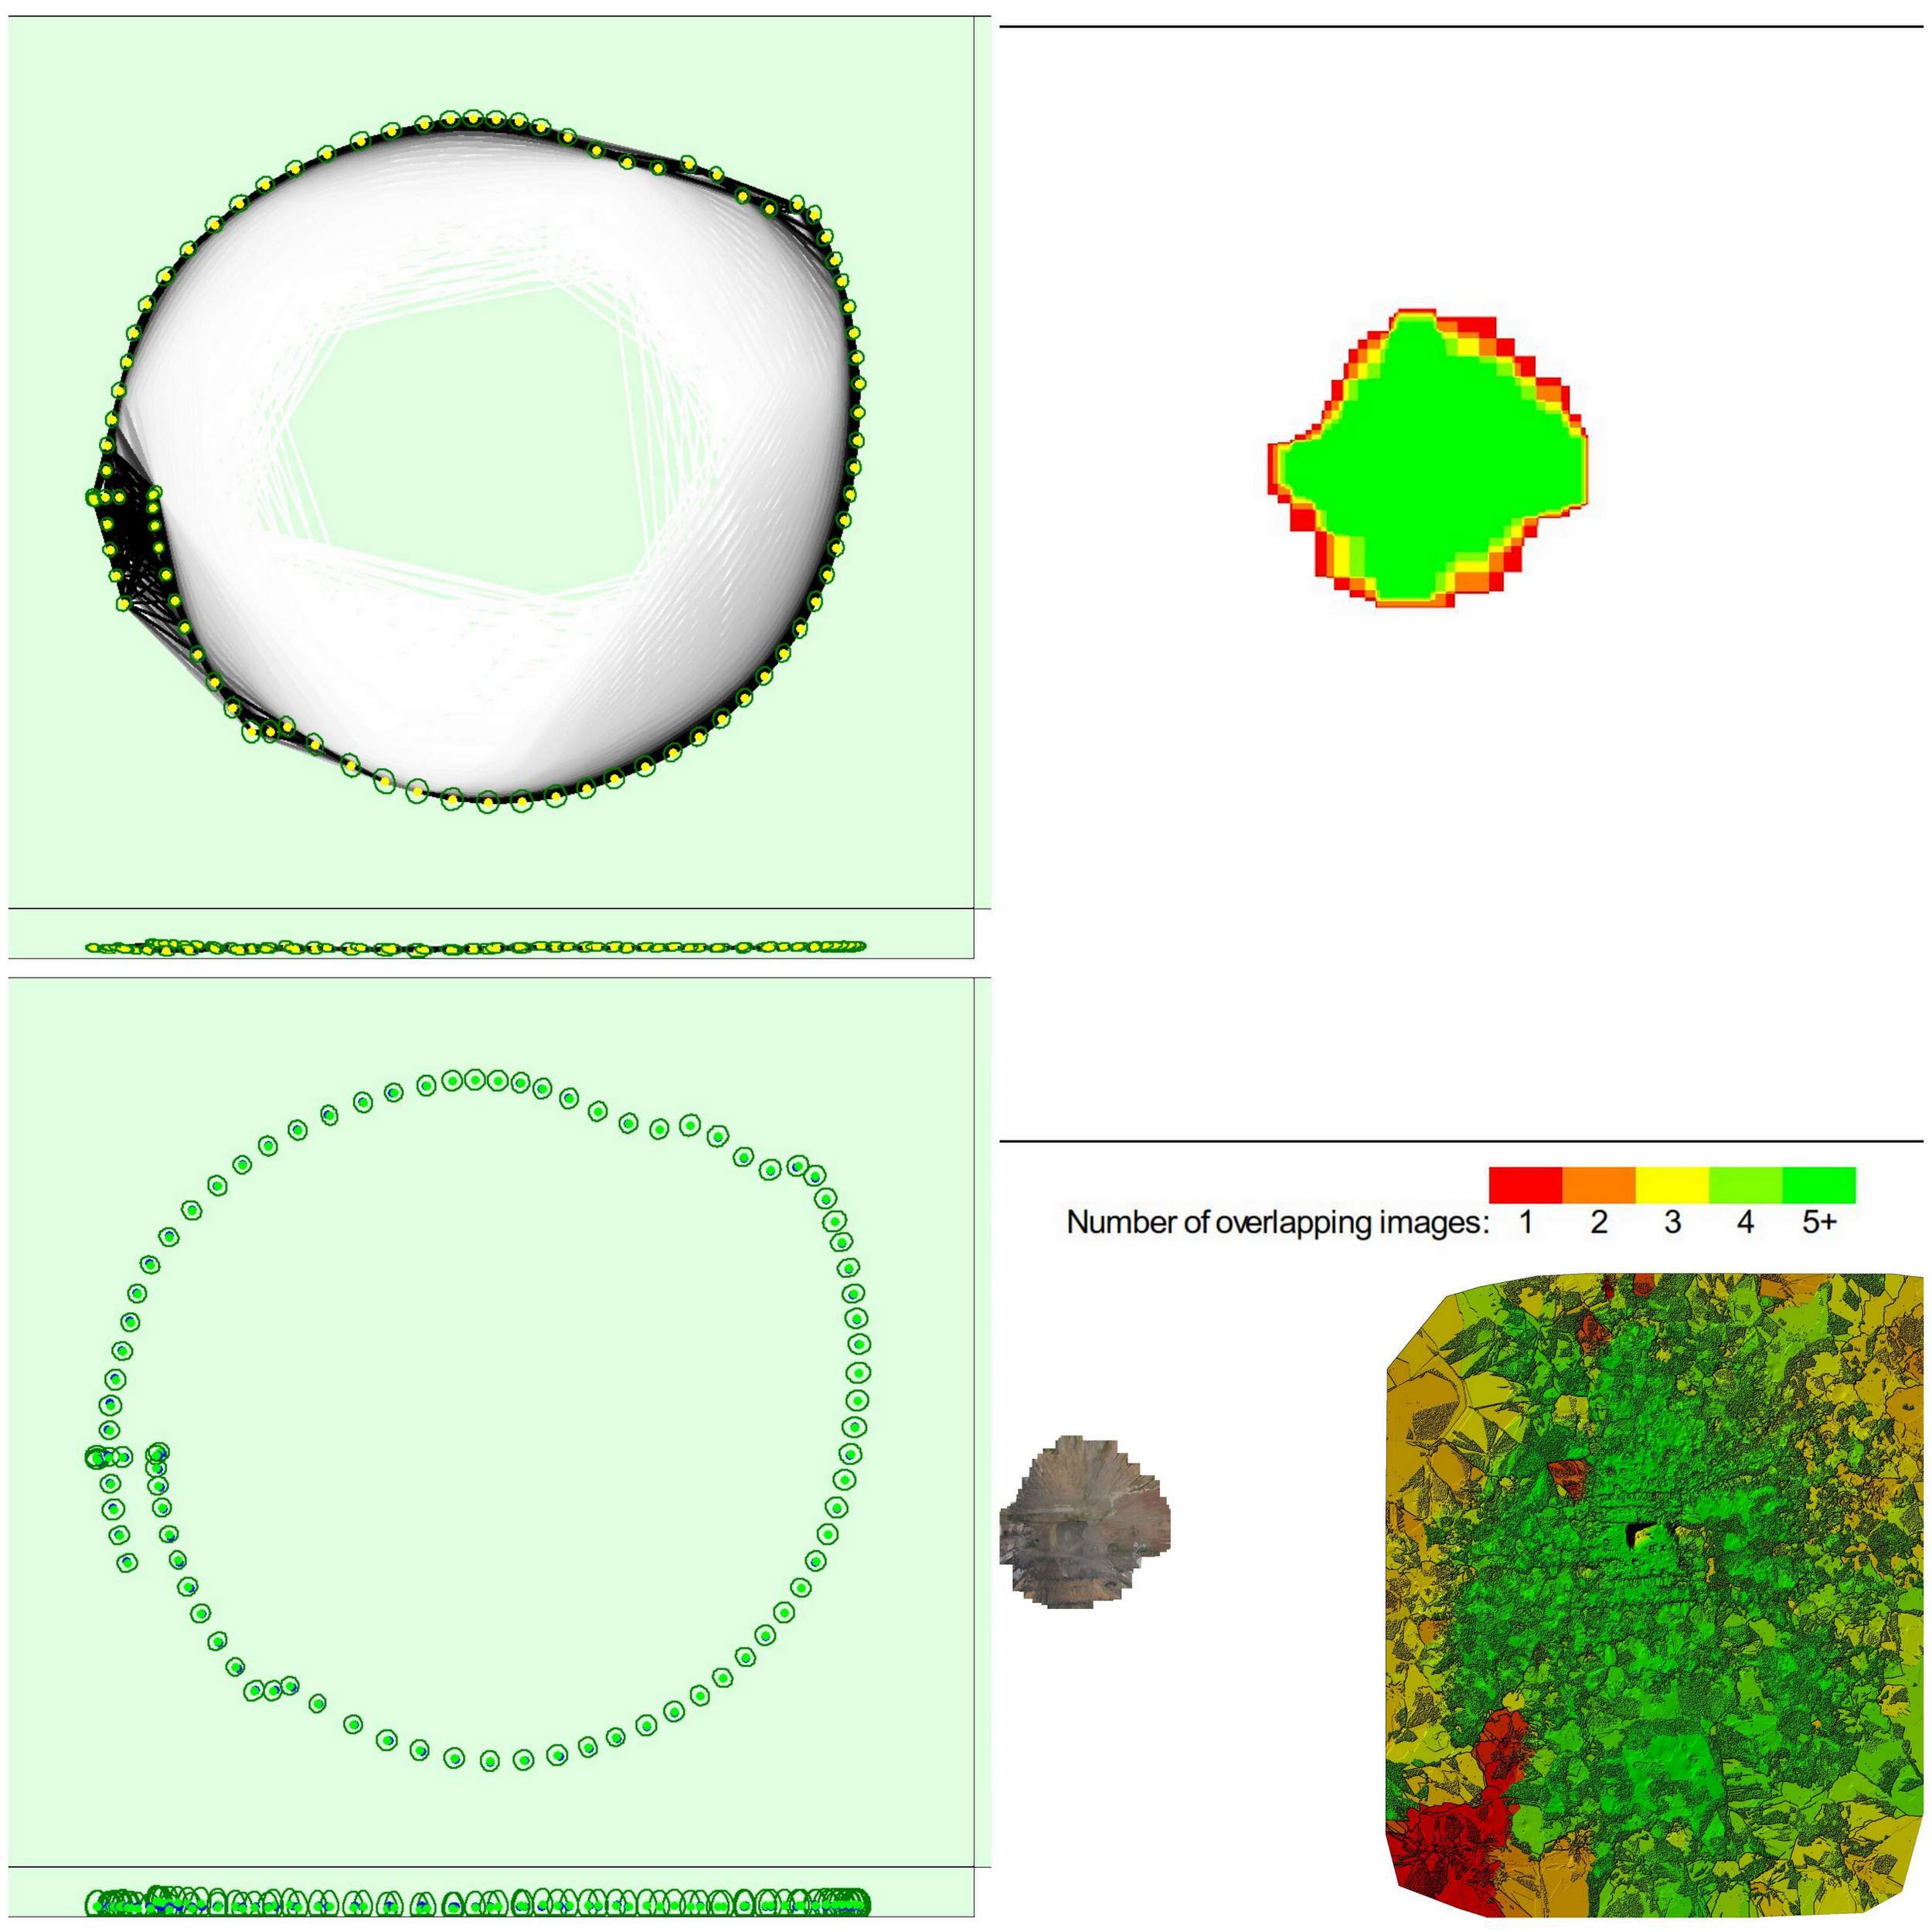
The drone was flown around the pile at multiple heights in a circular pattern, capturing photographs from every angle with 90 percent overlap between consecutive frames, higher than a typical survey, to push accuracy up for post-processing.
Step 4: Simultaneous DGPS rover walk
While the drone was in the air, a senior surveyor independently walked the stockpile surface with a rover DGPS device, logging as many physical level points as possible across the pile.
Step 5: Photogrammetry and NERF processing
Back in post-processing, the drone imagery was run through photogrammetry to build a 3D mesh, and separately through a NERF based reconstruction to generate a second, independent 3D model.
Step 6: Three way comparison and delivery
The photogrammetry mesh, the NERF model, and the DGPS point surface were compared against each other before the final quantity takeoff was signed off and delivered to the client.
Three independent models, one pile
What made this project a useful engineering exercise, and not just a routine flight, was the decision to build three separate representations of the same stockpile and compare them against each other rather than trust any single output.
Photogrammetry mesh
Built from the overlapping drone photographs, this is the standard method for turning aerial images into a measurable 3D surface for volume calculation.
NERF based model
A newer reconstruction technique run on the same image set, producing an independent terrain and surface model from the identical drone dataset.
DGPS point surface
Physical ground truth, built from level points walked and logged directly on the stockpile by a surveyor using a rover DGPS device.
| Comparison | Method A | Method B | Observed Variation |
|---|---|---|---|
| Model cross check | Photogrammetry mesh | DGPS point surface | Approximately 1% |
| Aerial vs field device | Drone derived data (combined) | DGPS device data | Approximately 2% |
| Field time required | Drone circular flight | Full manual DGPS walk | Drone notably faster |
Field note: The GCPs were deliberately marked on nearby pavement, not on the stockpile itself. A loose, shifting surface is a poor place to anchor a control point that the entire post-processing accuracy depends on.
What the comparison actually told us
The photogrammetry mesh and the DGPS ground truth landed within about one percent of each other. That is a tight enough margin that either dataset could reasonably stand on its own for a commercial takeoff. Where the drone approach pulled ahead was time. A full manual DGPS walk across a large stockpile takes hours of physically climbing an uneven, sometimes unstable surface. A circular drone flight covers the same volume of data in a fraction of that time, without anyone needing to walk the pile at all.
When the combined drone dataset was checked against the DGPS device readings, the variation moved to around two percent, still within a range most clients would consider acceptable for stockpile inventory purposes, but a useful data point on where the boundary of confidence sits for larger or more irregular piles.
Drone based photogrammetry is reliable enough for stockpile quantity takeoff on large masses, and it gets there in a fraction of the field time a manual survey needs.
Watch the field process
The clips below walk through GCP marking, the drone's circular flight around the stockpile, and the three post-processed models side by side.
Need a defensible number for your next stockpile inventory?
Talk to our survey teamWhere this approach fits
Not every stockpile needs three separate models built and cross checked. For a small pile or a low stakes internal estimate, a single drone flight processed through drone survey and quantity takeoff services is usually sufficient. The double verification approach earns its cost when the volume is large, the material has commercial value attached to it, or the client explicitly asks for a comparative accuracy check before signing off on a number.
The core technique underneath all of it, turning overlapping aerial photographs into a measurable 3D surface, is explained in more depth on our photogrammetry technology page, including how overlap percentage and flight height affect the final mesh quality.
For this Gujarat site, the answer the client walked away with was simple: the drone data held up against ground truth within about one to two percent, and it got there in three hours instead of a full day of manual walking. For a stockpile that changes shape every time a loader touches it, that speed matters as much as the accuracy itself.